
Google Sheets
Google Sheets QUERY Function: SQL-Like Analysis in a Single Formula
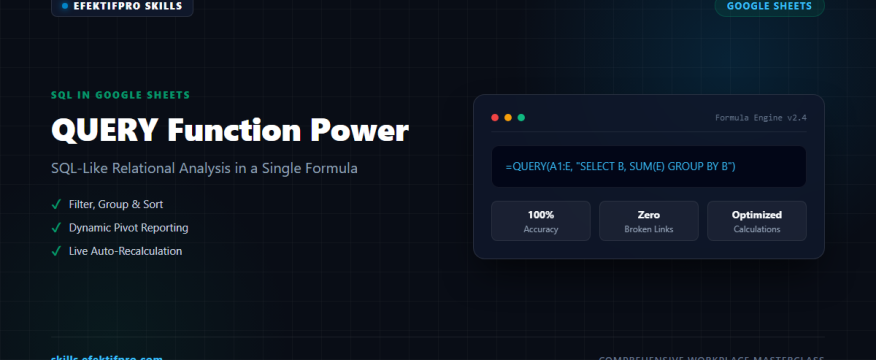
skills.efektifpro.com – Among spreadsheet platforms, Google Sheets possesses an unrivaled competitive advantage over standard Excel: the native QUERY function. Powered by the Google Visualization API Query Language, QUERY allows analysts to perform comprehensive relational data filtering, grouping, sorting, and dynamic aggregation inside a single cell formula without creating multiple helper columns or manual pivot tables.
⚡ Universal QUERY Formula Anatomy
=QUERY(data_range, "SELECT Col1, Col2 WHERE Col3 > 100 ORDER BY Col2 DESC", [headers])
Remember: Query commands must always be wrapped in double quotes, and clause ordering matters strictly: SELECT > WHERE > GROUP BY > ORDER BY > LIMIT > LABEL.
Standard Clause Execution Hierarchy
The query language enforces a precise clause hierarchy. Placing clauses out of order will trigger an immediate parse error:
SELECT: Specifies which columns to retrieve or calculate (e.g.,SELECT A, B, SUM(D)).WHERE: Filters rows meeting specific conditions (e.g.,WHERE D > 500 AND C = 'Active').GROUP BY: Aggregates records across categorical columns (required when usingSUM,AVG,COUNT).ORDER BY: Sorts outputs in ascending (ASC) or descending (DESC) sequence.LIMIT: Constrains output row count (e.g., top 10 rankings).LABEL: Renames column headers on the fly (e.g.,LABEL SUM(D) 'Total Net Revenue').
Hands-on Workplace Example: Building an Automated Departmental Summary
Suppose you maintain an active raw orders sheet named Orders!A1:E500 with columns: A (Rep), B (Region), C (Quarter), D (Status), E (Sales Amount).
To produce an executive summary showing Total Completed Sales by Region for Q1, sorted from highest to lowest revenue:
=QUERY(Orders!A1:E500, "SELECT B, SUM(E) WHERE D = 'Completed' AND C = 'Q1' GROUP BY B ORDER BY SUM(E) DESC LABEL B 'Sales Region', SUM(E) 'Total Closed Revenue'", 1)What this single formula accomplishes automatically:
- Filters out unfulfilled or cancelled orders (
WHERE D = 'Completed'). - Filters down to Q1 transactions exclusively (
AND C = 'Q1'). - Aggregates totals per region automatically (
GROUP BY B). - Ranks regions from top-performing to lowest (
ORDER BY SUM(E) DESC). - Replaces technical column headers with presentation-ready titles (
LABEL ...). - Updates in real time whenever new rows are appended to the raw data sheet!
Critical Caveat: Mixed Data Types
The Google Visualization API expects every column to contain a consistent data type (either 100% text or 100% numbers). If a single column contains both numbers and text (for instance, tracking numbers where some are numeric 10293 and others contain letters TRK-10294), QUERY will treat the minority data type as null blank cells. Format the entire source column explicitly as Plain Text to prevent data loss.
📚 Related Google Sheets Guides